Research for clustering point data in digital mapping
Abstract
This article states a clustering algorithm for dynamic points at different zoom levels on digital mapping. Urban, landscape, or architectural designers could use this methodology to represents data as visual groups or to reveal insights from data while interacting data directly, on the stage of analysis and decision-making process.
1 Introduction
Data become much more available for designers, and it enables us to understand urban contexts with the lens of data of cities. Design practices with data allow designers to identify a pattern of data in different level of scale, or interpret the relationship with other layers of data. There would be many visual processes minimizing noises and maximize the contrast of insights from data. Particularly point representation on maps is a basic and essential visual element to visualize data. Clustering Algorithms promote process the point data to filter out insights as a meaningful visual language.
Clustering methods are well-known and conventional techniques to identify groups of data. Based on domains and purposes, the types of methods could have could deploy in the stages of analysis, processes, and visualizations.
Type of Clustering
- Hard Clustering
- Soft Clustering
Type of clustering algorithms
- Partitioning methods
- Hierarchical clustering
- Fuzzy clustering
- Density-based clustering
- Model-based clustering
- and more…
On mapping using digital medium, as long as the data has such location information as geo-graphical position, screen position, a single number, or any other paired multiple numbers that could be interpreted by projections, the data can be visualized by a point as a chart or map on screen or paper. There would be two types of points, (1) static point (2) dynamic point that may have a timeline or designer could add a point interactively to reveal patterns.
2 Collision-based dynamic grid graph for clustering points
The Collision-based dynamic grid graph for point clustering algorithms is introduced for clustering dynamics points. This is a hybrid method of clustering points in an interactive and intuitive way visually on the different zoom levels of digital mapping.
While the traditional grid-based(Partitioning) clustering would be suitable for lots of points for static data visualization. it is not a proper way for clustering dynamic points with different scales on different zoom levels. In the grid-based system, while you interact with a point by adding or moving the point, the cluster happens not based on the centroid of aggregated points but based on the grid, which is not that intuitive for dynamic repositioning points.
It addresses a special clustering technique for adding and translating points dynamically in an intuitive way for digital mapping. This method works on both renderers (1) static renderer (such as SVG or HTML Canvas ), (2) dynamic renderer(HTML Canvas, OpenGL, or WebGL).
2.1 Methodology
Collision-Based Dynamic Grid Graph method for clustering points consists of Five steps:
1: Build connectivities based on collision
2: Construct cluster graphs based on the connectivities
3: Recursive checking for the collision while repositioning clusters by adding adjacent points
4: Tessellate big clusters based on a resolution
5: Post-process for merging based on a tolerance
- Each step has unique computing and should happen in order, per each frame before rendering. It also needs to be rendered after changing the view by panning or zooming.
- Top-down process:
(1) collision detection for point → (2) graph → (3) graph interacting with points → super graph → subgraphs - Bottom-up process:
(4) subgraphs → (5) generalized super graphs - Performance
- Useability
2.1.1. Collision-based Clustering
As a first step of the clustering, it checks whether it collides with others or not through Axis-Aligned Bounding Box (AABB) collision detection. Each point on a map remembers its neighbors
2.1.2. Cluster graphs
Based on the groups of collided points, graphs are generated. Once merging the sorted points as a cluster graph, the graph itself could possibly collide with other ungrouped points. The centroid of points in the graph becomes the center of the graph, repositioning the graph, resulting in the need to recompute the connectivity recursively below.
2.1.3. Recursive update of graphs
However, although the collision-based system works correctly in most cases, some edge cases show issues about a cluster containing concatenate following points recursively. This computation enables users to interact with the points dynamically.
2.1.4. Hierarchical sub-graphs
Due to recursive checking, sometimes the cluster could concatenate the possible independent cluster graphs like a block hole. As a generalization, the subdivision of the graph could be executed on the basis of a resolution which could have something to do with the visual looks or style of the graph, preventing from getting stuck with each other visually. It allows users to understand which cluster could contain the translating point, while interacting point with other points or clusters.
2.1.5. Merged graphs
in the previous steps, they process the graph against point, but in this final step, we have an additional generalization to apply graph against other graphs or subgraphs.
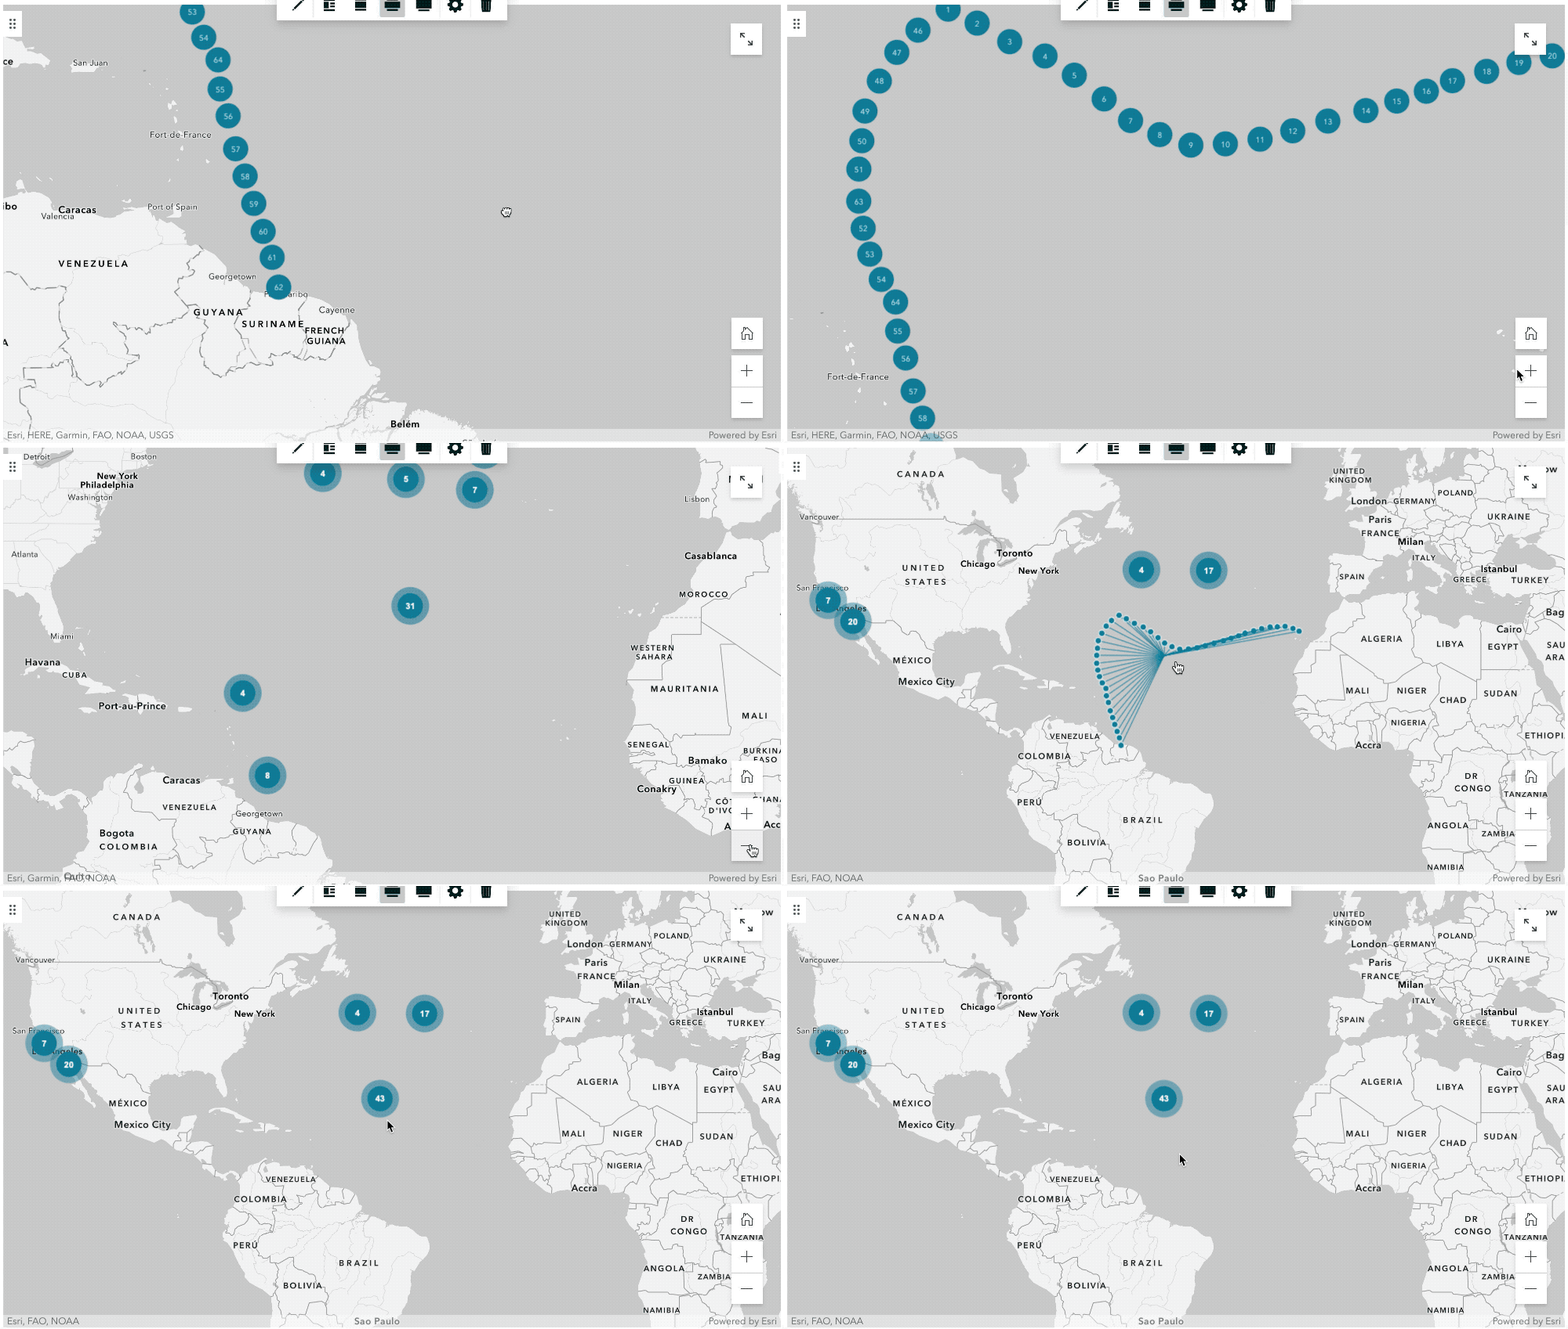
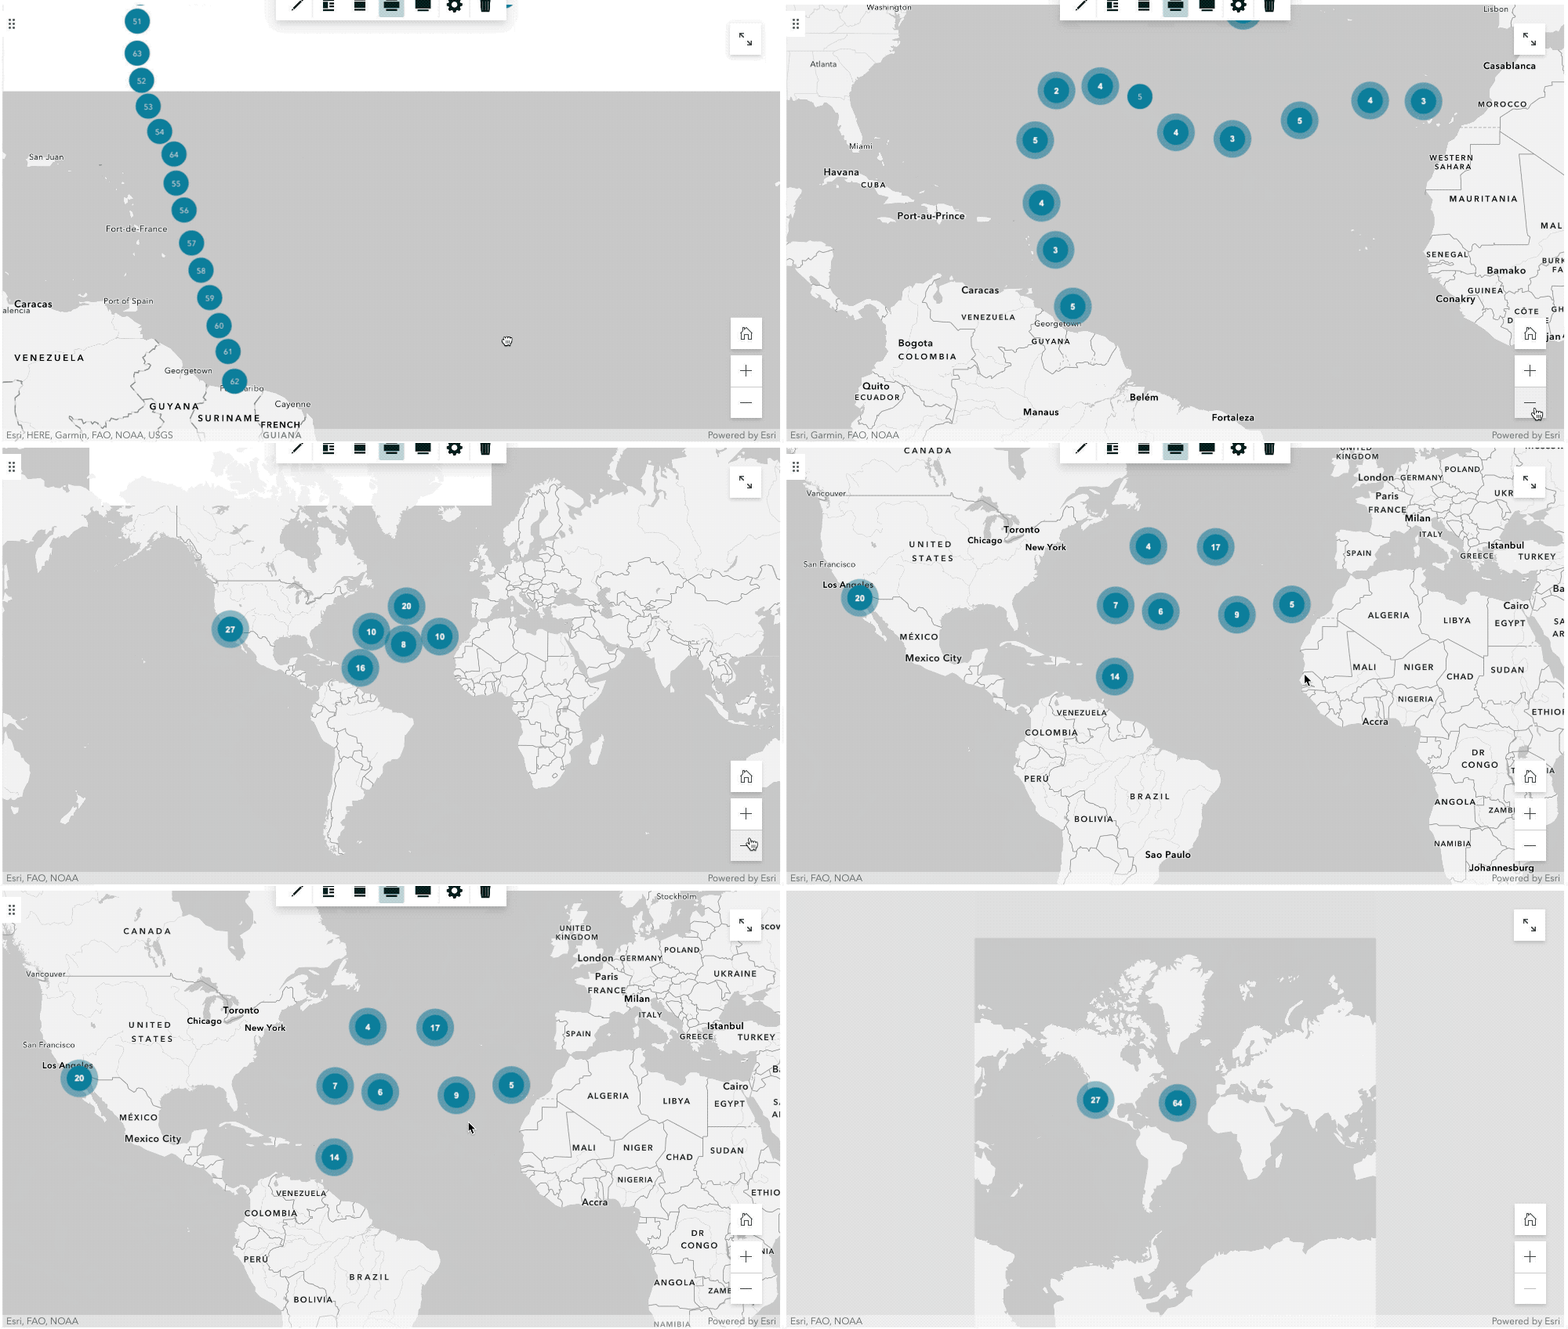
3 Implementation:
This method deployed in the product of ArcGIS StoryMaps.
(1) Collision-based Clustering
(2) Cluster graphs (3) recursive update of graphs

(4) Hierarchical sub-graphs and (5) Merged graphs

4 Conclusion
In this article, I address a methodology for a clustering algorithm to cluster dynamic points, which users or designers can translate freely while rendering and visualizing point data at different zoom levels. This method allows them to reveal patterns or visual cues while interacting with point data directly.
5 Future work
- This low-level method could be customized in different ways based on the purpose of clusters and the type of data.
- According to Euclid’s Definition, “A point is that which has no part." In that sense, Point is about data of positions not the area, but clustering is about the discretizing area. In terms of visualization and mapping for designers, heat-map like (continuous interpolated area) clustering could reveal another face of data, maintaining the meaning of point data.
reference:
'Workshop Index' 카테고리의 다른 글
| [Cheat Sheet] Machine Learning, Deep Learning, Artificial Intelligence, Keras, Neural Networks, Skicit-learn, Pandas Data Science (0) | 2022.12.27 |
|---|---|
| [Cheat Sheet] Python, List, Data Types, Class, Pandas, Numpy, SKlearn (0) | 2022.12.27 |
| Digital Mapping using ArcGIS JSAPI (0) | 2022.12.25 |
| Discrete Urban Space and Connectivity (0) | 2022.12.25 |
| AI for designers (0) | 2022.12.14 |


