Data & Design
Computational Design, NJSTUDIO
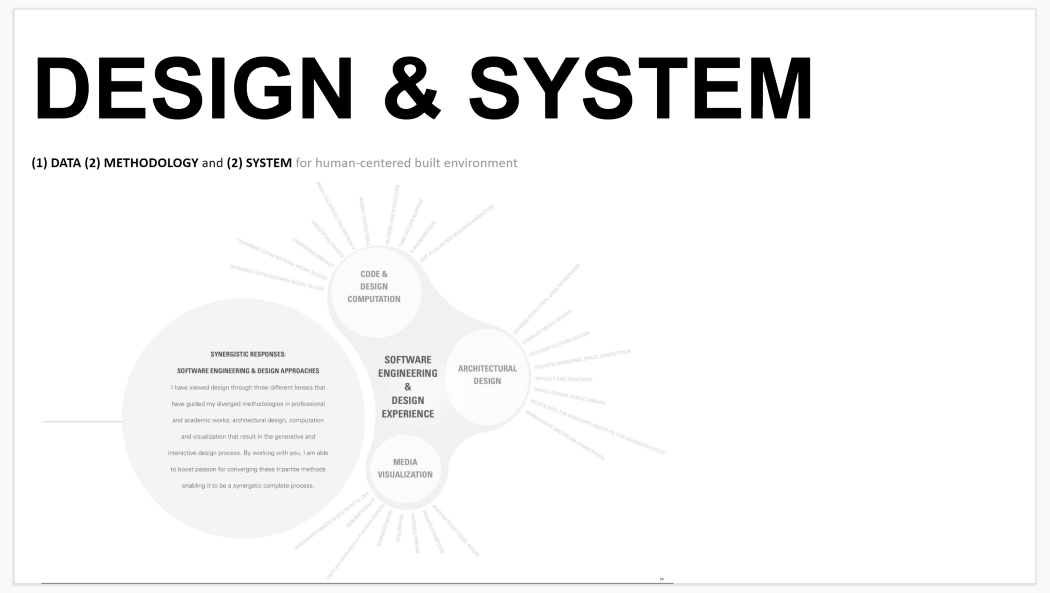
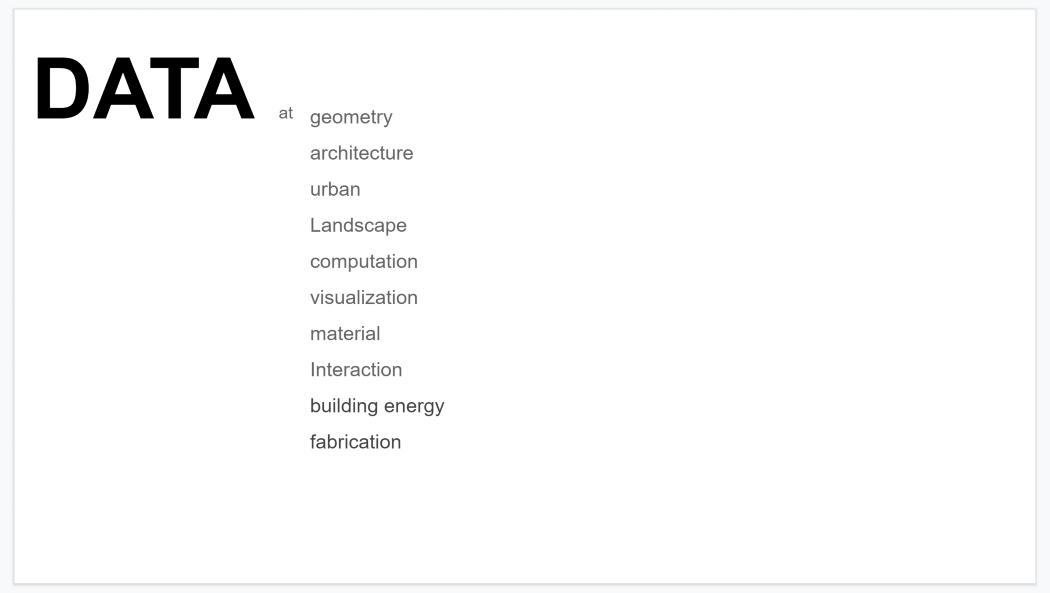

Data is becoming increasingly available not only for specialists but also for designers in diverse ways. The importance of data has led to the new age of design, and it made possible holistic design approaches in architectural, landscape, and urban design. Optimization, parametric design, data-driven design, and something fundamentally rely on data. The use of data in design is becoming much more significant than ever before. Mainly, the change of our life by autonomous vehicles, IoT, blockchain, or smart cities based on 5G technology will accelerate the way of living and thinking, generating and consuming data every single day.
Software is a way to package knowledge in a usable form or mobile or distributed structure. Software is not just a tool, but a bundle of knowledge of technique or method in action series to process data. The software contains lots of fundamental algorithms and logic that people have developed in the history of math, science, and architecture whenever you use a software or CAD program behind the scenes. The data is cooked based on recipes of the knowledge for the software. The interface is how to expose the knowledge to others as a set of sequences as a visual form on the screen where designers or users design their custom menus based on given recipes of the algorithms.
CAD Technology and interaction was quite mutual around early 2000. However, we have the emergency of new tools that are Interactive after that. Real-time graphics, interactive motion analysis and detection, Dynamic optimization system, and machine learning related applications will open the opportunity to explore manifold possibilities in design. As a form of software, the package of knowledge will deploy in different circumstances as they need and interact with the software.
Through Web Environment, everything in the world is interconnected with each other. In everyday life, we use email, search the web for information, check the weather, and traffic. We take and share their pictures or videos based on such international services or platforms provided by Google, Amazon, Facebook, Microsoft. Around late 2000, Software industries started migrating their software, products, or apps from the local environment to the web. The CAD industry is no exception. It means that the apps in mobile or browsers we use these days are a getaway of all of our virtual worlds where we talk and develop designs, resulting in data.
Visualization & Interpretation
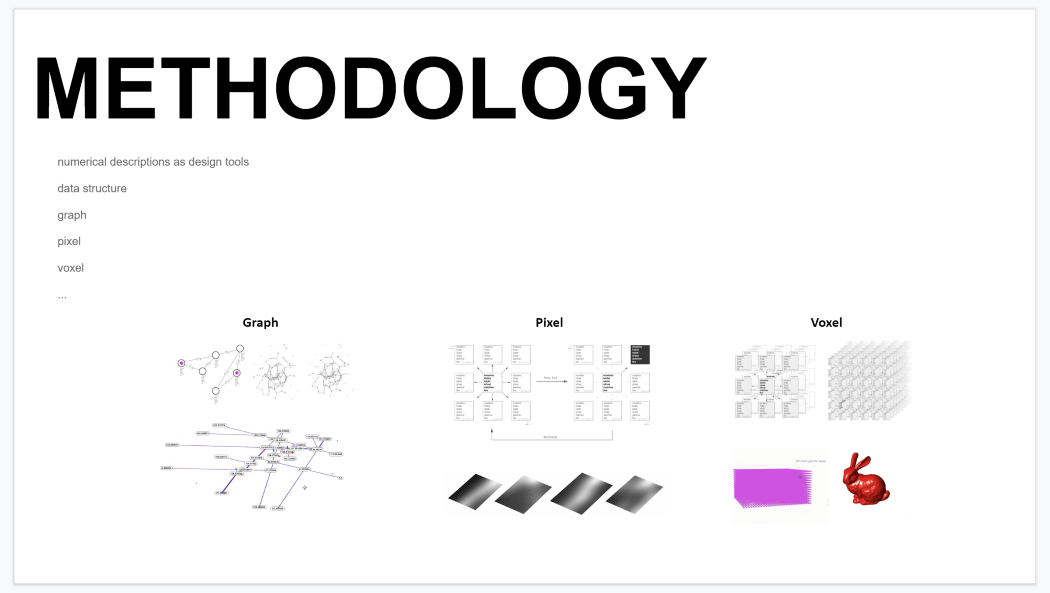
What is visualization? There would be different definitions in different domains. But It could be considered as a way of printing a result from computational operations as a human visual language on a screen or a paper. A simple math equation gives us a result, such as three from 2 + 1. There would be no misunderstanding happening here because three is just 3 in that straightforward operation. But not every data has a single interpretation of data in this real-world because it is not that simple. Data is a sort of numerical representation of facts, thus the decode and interpretation are needed to understand the meaning of the data.
00:24 — overview : data, methodology, and system — link
06:43 — urban data / network —link
08:46 — urban data / machine learning —link
11:00 — geometry data / deep learning —link
13:00 — optimization / parametric design — link
15:58 — structure data / optimization — link
18:41 — geometry data / dynamics — link
20:24 — landscape data / environmental data —link
22:28 — image data processing — link
25:13 — fabrication data / digital mock-up —link
26:07 — material data / computation — link
28:20 — interaction / robotics — link
31:56 — particle simulation / data — link
34:53 — lecture and workshop series — link
35:24 — domains and technologies — link
36:37 — keywords — link
37:02 — thank you —link
Korean Version — link
'Workshop Index' 카테고리의 다른 글
| Third Place Analysis and Implementation (Design, Data, Artificial Intelligence) (0) | 2022.12.09 |
|---|---|
| Computational Design Thinking for Designers (0) | 2022.12.09 |
| [특강 2022] 첨단미디어디자인전공 "1학년"을 위한 디자인, 데이터, 코딩 소개, 다가오는 시대, 기회, 준비전략, 동기부여 그리고 멘탈리티 (0) | 2022.05.13 |
| Rhino Grasshopper 학습 자료 & 개념 이해 (0) | 2022.04.23 |
| Design Scripting and Visualization, Web App (0) | 2021.09.11 |


