
Author: NJ Namju Lee
NJSTUDIO Director, ESRI Software engineer
Linkedin
nj.namju@gmail.com
Source code
Korean Version / English Version
Table of Contents
1. Preface
2. Project outline
3. Process summary
4. Project process
4.1. Collecting Third place data and mapping (visualization)
4.2. Data understanding and purification (preprocessing), category reduction (dimension reduction)
4.3. Weight and distance functions between spaces (abstraction of phenomena, quantification)
4.4. Qualitative and quantitative data interpolation, additional dimensions, discretization, model selection
4.5. AI, Learning, Fitting, Validating, turning
4.6. Model, application, validation, and analysis
4.7. Development direction, attention, and possibility
5. Conclusion
6. Reference
1. Preface
The Third Place analysis project started from the research at the City Science Lab (2016), Media Lab, Massachusetts Institute of Technology (MIT), and it was published at the 2nd International Conference on Computational Design and Robotic Fabrication (CDRF) conference. It is a research for the methodology that analyzes the third place distribution that composes a city to extract, form, and understands the trends of cities, apply and compare them to other cities, and understand the city from a Third place perspective.
“Third place” refers to spaces located between home and work. For example, libraries, coffee shops, health clubs, banks, hospitals, bookstores, karaoke rooms, and parks are classified as third place. When developing urban planning, urban regeneration, environmental analysis, analyzing the relationship of a specific building site, evaluating real estate values, selecting the location of a large franchise such as Starbucks, analyzing third place trend and distribution understanding is essential. As such, the knowledge of third place has become a significant factor widely used in diverse fields. This analysis has traditionally understood the city through data mapping by directly visiting each space, measuring the distance, counting the street environment and floating population, and tracing it on a map.
Around 2010, the Big Data trend and later the artificial intelligence (AI) boom are inverting and expanding the perspective and technology of looking at data from the specialized area to the public domains. Just as generalized commercial digital design software replaces traditional design tools, open-data and pervasive hardware and software tools that can process the data are in front of designers today. In the third place analysis and application process, I would like to describe the material for design, called data, and the attitude, role, and methodology of the designer who processes the material.
2. Project outline
Project Name: Third Place Analysis
API: Google Place API
Programming Languages: Python, C#, Javascript, HTML, CSS
Libraries: NJSCore, Tensorflow, Numpy, Pandas, SKLearn…
Applicable cities: Boston, LA (Los Angeles), Redlands
3. Process summary
Let’s summarize the whole process first. (1) Hypothesis (question, concept, problem, objective, or issue description) is established that the development and distribution of the third place in the Boston area have the characteristics of the city. (2) Collect third-place information using Google Place API. (3) Calculate the distance of each place. (4) Refine the calculated location trend. For example, it is possible to dataize each space through the probability of reaching a third place within a distance of 5 minutes, 10 minutes, and 15 minutes walkable, or according to the actual distance. These later (5) are used as individual training data in the artificial intelligence (Machine learning) fitting process.
This process is not linear. But, as shown in the diagram below, (6) information in third place becomes trainable data through an iterative process. (7) Learn, verify, and implement a model that explains the third place distributed in the city by learning not only Boston but also New York, LA, London, or Gangnam. (8) From the perspective of the application, a static pattern or dynamic trend of a city can be analyzed. Or, it can be used as a process, basis, or insight when comparing different cities, applying the same, or designing with another city character.

Conceptually, there are various ways to implement artificial intelligence, but in reality, a large number of artificial intelligence we experience these days are implemented by machine learning. In other words, it is programmed by data. Looking at the figure below, traditional programming means designing the contents of the programming (deduction method) to return the result by defining the sequence and conditions according to the purpose. But machine learning does the opposite. In other words, much data is given first as a result, and the process can be inferred through the result to reverse engineer (inductive method) the program coding. This process is called learning, and when the learning accuracy is good, it is said that the fitting of a model(a program) is well. For example, the traditional method (deduction method) is advantageous when implementing deterministic explicit functions such as multiplication tables.
However, it is virtually impossible to design a program with almost infinite logic branches(conditional statements) through the traditional method in response to different driving environments since many variables have to be considered, like autonomous driving. Therefore, creating a stochastic model based on numerous driving data, in this case, is advantageous and realistic. In other words, by reverse engineering (inductive method), programming is a process through data; as a result, the pattern contained in the data is programmed (Representation Learning) so that it can respond with high reliability to the data(new driving environments) to be newly input. In this project, we will learn about the implementation and application of artificial intelligence models that can be applied to various situations through the patterns, signals, and insights contained in the data by learning with third-place data.

4. Project process
4.1. Collecting third place data, and mapping (visualization)
“Data is a representation of a phenomenon.” The phenomenon can be effectively captured as an abstraction and compressed digital information document. It is common to start understanding data by projecting such data into a visual language familiar to humans. For example, digital maps such as Google Maps help map/visualize spatial information and serve as an interface to access recorded urban data. In other words, if you use the API service of the digital map, you can download various city information or access it in real-time to process and utilize the data. For example, it is the same principle as creating a variety of foods by refining the taste and nutrients implied by data.
The phenomenon becomes a model based on the contents and patterns of spatial information. For example, if there is a time series in the data, you can gain insight into changing trends. Furthermore, with service’s start and end times, customer visiting patterns, preferences, etc., more specific and specialized phenomena can become a model through data. According to the hypothesis established above, it is common for these metrics to implement and verify causal relationships by repeatedly processing clues that directly/indirectly imply a phenomenon, that is, data, and the iterative process starts with mapping.
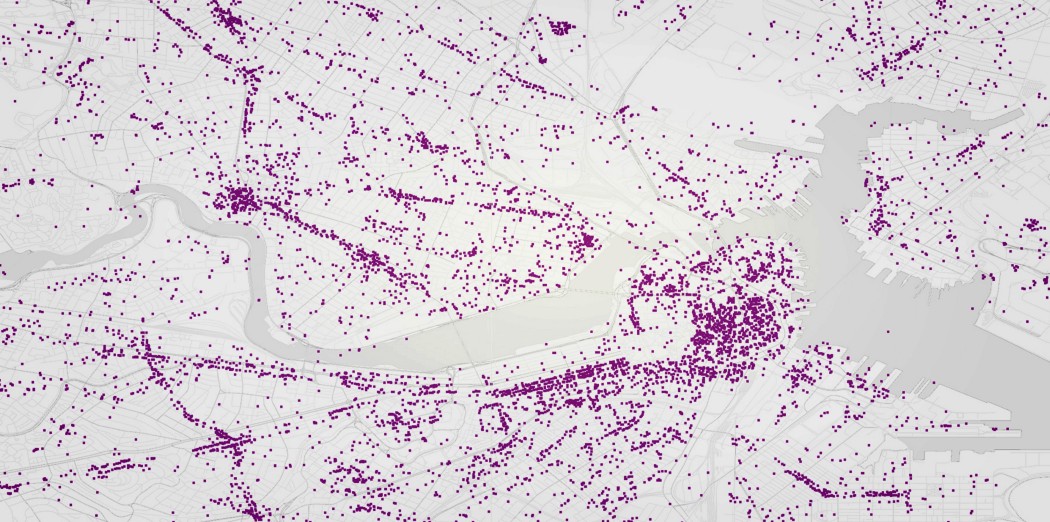
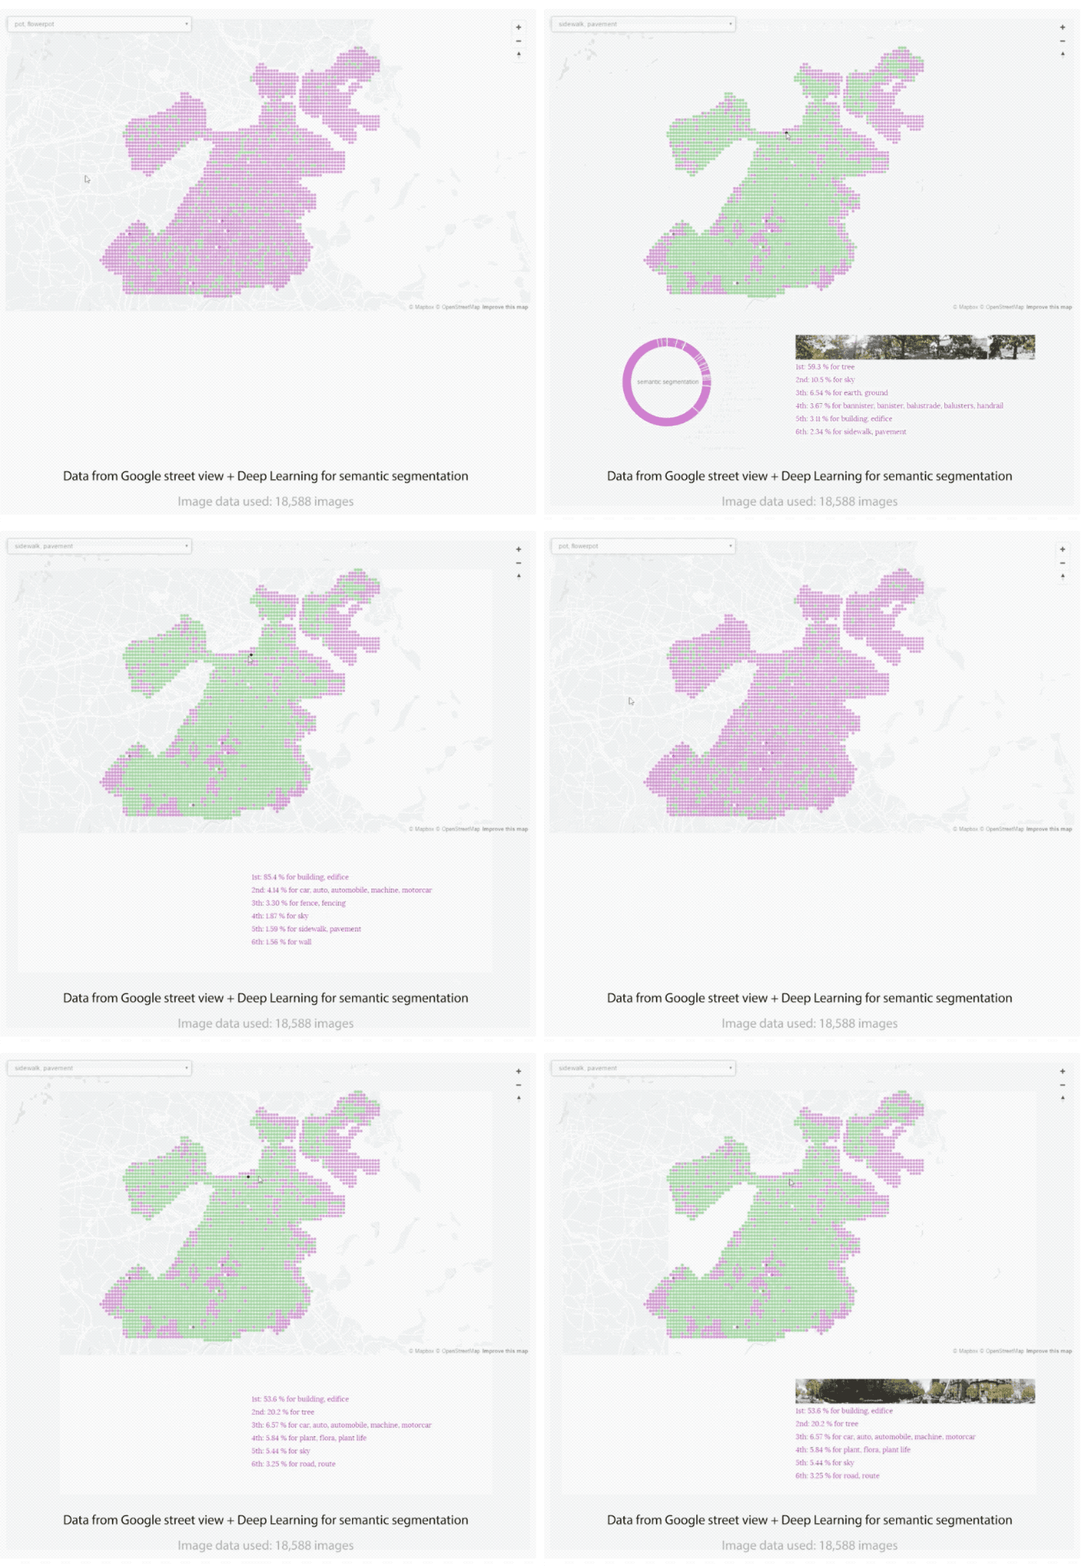
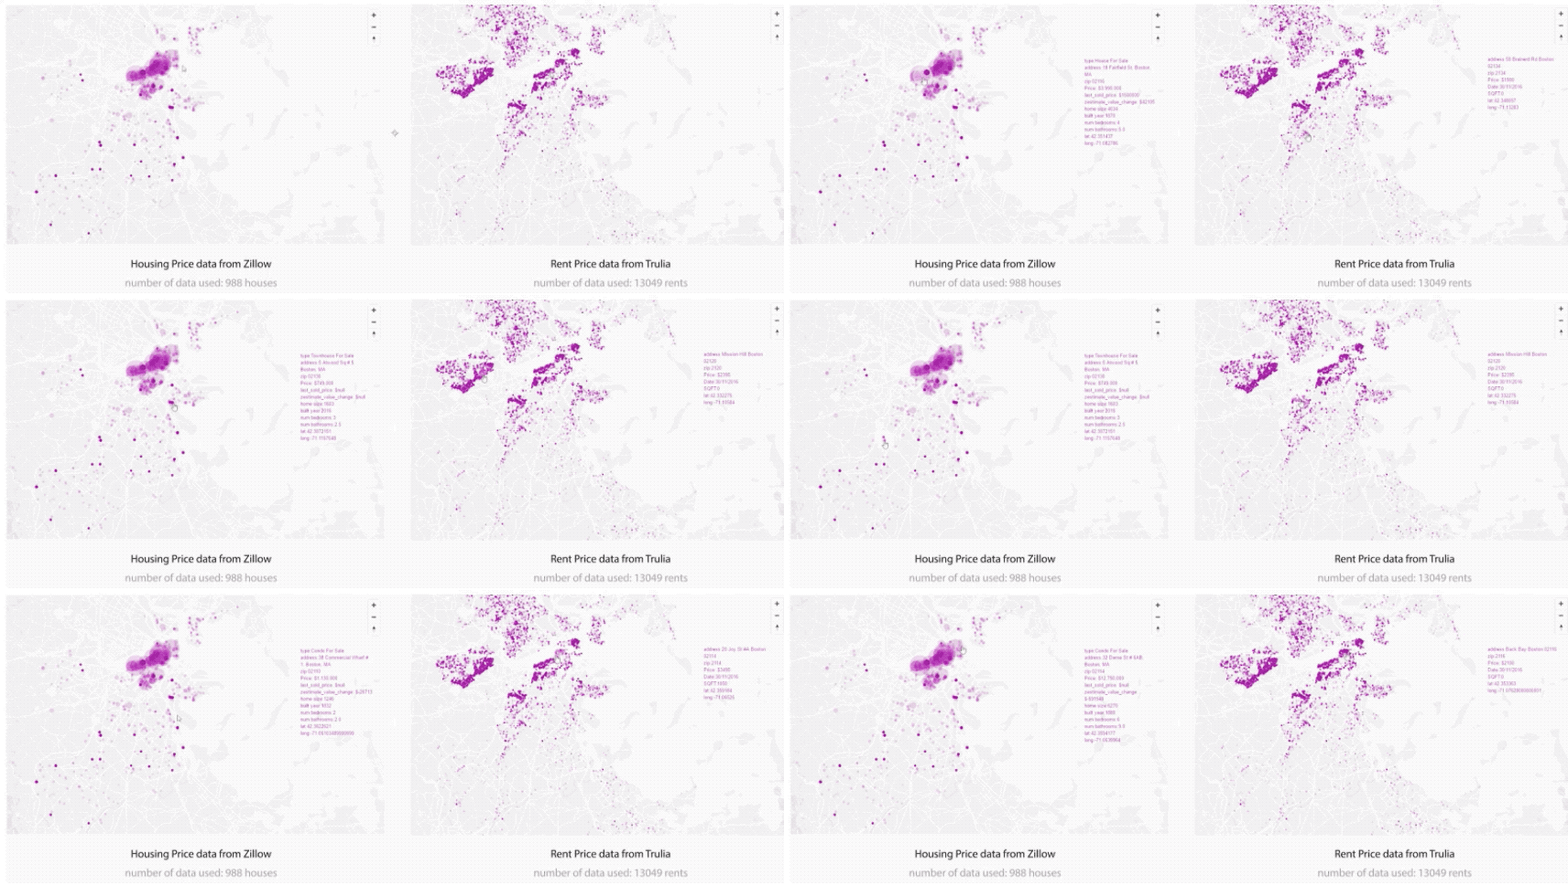
The following image is an example of mapping each location in Boston. For instance, 4,250 third place data were visualized in the Boston and Cambridge areas in 95 categories (hospitals, parks, libraries, convenience stores…).



4.2. Data understanding and purification (Preprocessing), category reduction (Dimension reduction)
“Data is a feast of compressed insights into the phenomenon.” Therefore, a refining process such as data preprocessing is essential to reveal these data’s knowledge, insights, and wisdom. One of them is the dimension reduction method. Statistical dimensionality reduction methods with high performance and reliability can preserve information well depending on the format and content of the data. In particular, in this project, we want to focus on reducing the dimension of data through the designer’s perspective and experience.
Most of the raw data we access through the Internet can be modeled at a higher level if the data is refined according to its purpose or issues. But, as there is said, “Garbage in, garbage out” (GIGO); the process of understanding data and increasing its purity requires the use of materials (big data) and refining tools (code, artificial intelligence, algorithms, etc.). In addition, it is also a stage where designers must directly intervene and demonstrate their domain knowledge. Finally, the data needs to be collected and refined to create and fine-tune trainable data that can achieve desired goals and explain hypotheses. In other words, just like an architect refines a single raw material to design diverse parts of buildings based on purposes, in the data-driven social paradigm, the “data purification process” for designers is an explicit logical flow without leaps and becomes the designer’s “design process”.
The total number of given data is tiny when considering the 95 categories. In other words, it can think that the data has much noise and is vulnerable to overfitting or underfitting. Therefore, through Dimension Reduction or Feature Selection, generalized phenomenon modeling that is not biased toward a specific phenomenon is possible. It’s like learning typical road driving situations in autonomous vehicles, generalizing them to various unpredictable real problems, and responding to them. For example, Japanese, Chinese, and Korean restaurants can be classified as restaurants, while taxis, bus stops, subways, and trains can be classified as transportation. In the case of a positive correlation that a gas station is located in the place where a vehicle frequently moves through correlation analysis, the relationship between the data sets can be merged into one dimension. In addition, it is to extract and process meaningful trainable data sets that can directly or indirectly explain the hypotheses described above by using statistical and mathematical techniques or experiences and insights from domain knowledge (architectural, urban, landscape design…).

The selection and processing of raw data obtained in the real world are very complex; such questions as what data will you use?; how to remove noise from the data, and reveal and capture the signal or pattern?; what metric space will you project into?; What data will strongly contribute to the results? The process is not linear. By repeatedly refining the data and patterns that directly/indirectly describe third place, it is possible to construct data that more explicitly represent and imply a phenomenon. If necessary, revisit and modify the hypotheses established above and analyze the data accordingly. Consider, combine, and refine the purity of the data set.
4.3. Weight and distance functions between spaces (abstraction of phenomena, quantification)
The advantage of spatial information is that it is relatively convenient to set up the relationships between data because it is possible to integrate and interpret the properties of space by abstracting and quantifying it into a location. For example, a specific place becomes a data set by adding a distance from each mapped third place or a property of a place as a parameter and a weight. A function that calculates a higher score for a short distance and a lower score for a far distance can be utilized. Furthermore, a process can be coded that extracts variables according to the reporting environment and fine-tunes their weights. In addition, by arranging places uniformly in the entire city space, it is possible to build a model that evaluates the overall accessibility by integrally calculating the distance weights from those places to reach other third places. In other words, it can be understood as a process of refining data that explains or answers a hypothesis into data optimized for the hypothesis.
There are several ways to implement a function that mathematically finds the distance. There are particular problems that each distance function can describe: Euclidean Distance, Manhattan Distance, Chebyshev Distance, Minkowski Distance, Cosine Distance, and so on. When we travel through the city, we use roads and sidewalks. Therefore, calculating the network distance that can reflect actual distance is a suitable method when quantifying more accurate phenomena and realistic patterns.


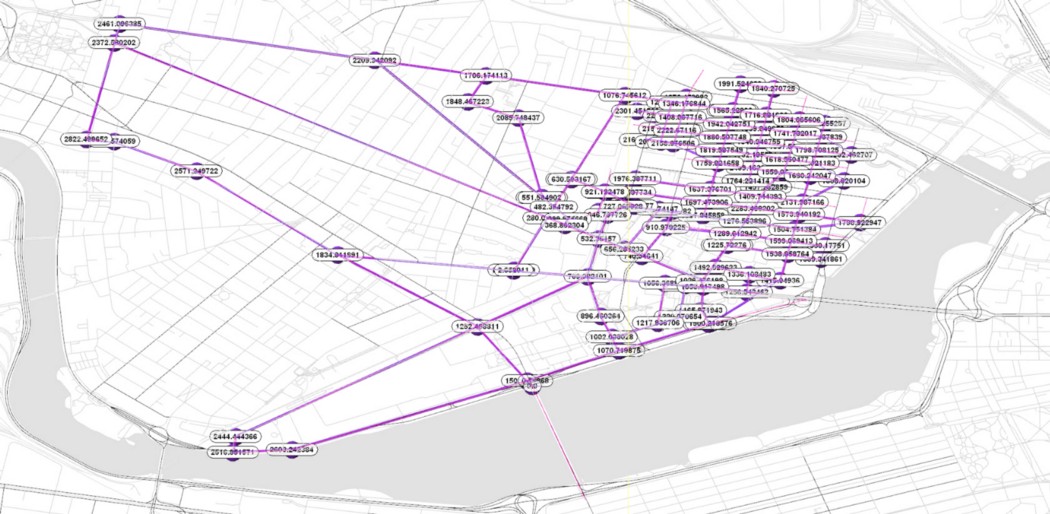
At the same time, traditional urban network analysis methods can be applied. For example, degree, betweenness, closeness, and straightness models exist for centrality analysis; the analysis methods such as Reach, Gravity, and Huff models can be used too for accessibility analysis. Mixing and modifying these methods allows the distance function to be implemented and applied according to the purpose or hypothesis. It can be used as a weight value for network calculation.


As discussed above, the purity of the signals and patterns embedded in the data can determine the completeness of phenomenon modeling, the implementation of artificial intelligence, and the reliability of the accuracy. For example, suppose the artificial intelligence model (or network) is learned by simply converting the third space into data according to the distance weight. In this case, the signals or patterns from data can be distorted by increasing the weight linearly according to the distance. It may emphasize the outliers, which are unnecessary, and is often inappropriate for the training process. Furthermore, it is not intuitive to understand the metrics of the data used.
Therefore, I will introduce two methods. First, the calculates weights based on the 5, 10, and 15-minute walkable places. Second, data is processed so that the longer the distance and the worse the external environment, the lower the probability of walking to a specific space (decay). For example, looking at the table below, the likelihood of approaching a place 100 meters away is about 15% when the β value is 0.02, about 38% in the case of β: 0.01, and about 70% in the case of β: 0.004. That means if there are 100 people, 15, 38, and 70 people will reach the place depending on the weather and walking conditions. For example, after defining various β values in a city and finding the final value through each defined β value for people’s arrival probability, it is counted in the city’s different seasons, weather, and environment through counting. Some studies trace back the β value that can be applied accordingly.

Alternatively, the distance average of third places in a given place may be used, or a median value may be used. As discussed above, it is the designer’s ability and role to build a methodology that processes trainable data sets to optimize the given data for the desired result. In this project, after finding the smallest value of the network distance of all accessible third places within a 30-minute walk from a point, we will focus on an example in which the probability of access to a place is used as a weight, assuming a relatively walking-friendly environment, will be.
4.4. Qualitative and quantitative data interpolation, additional dimensions, discretization, model selection
So far, we have seen that the distance from the starting point to the place can be trained as one data dimension through various distance functions to train an artificial intelligence model. However, cities are spaces where multiple parameters simultaneously interact. Therefore, a place can be treated by abstracting it as a single point for convenience. However, when considering the influence of space, the values must be interpolated to leave a trace on the surrounding area. For example, it’s like a case where a crime occurred and did not just affect the place. Therefore, it can be a practical and reasonable data interpolation method to consider the probability of exposure to crime even in spaces close to the road and its surroundings.
The image below is an example of visualizing the accessibility of the third place in each area by discretizing the urban space. For instance, in the process of moving from A to B, there are bound to be various inhibitory or facilitating factors. By calculating these variables in the movement path, a more comprehensive, flexible, and fine-tuning process can be built by incorporating qualitative and quantitative data such as culture, history, and sociality inherent in distance and space into the weight of the distance function. Of course, this is also the point where the designer’s domain knowledge and experience must be exerted, and depending on how the phenomenon is modeled, reliable essential insights and discoveries can be revealed from the data.
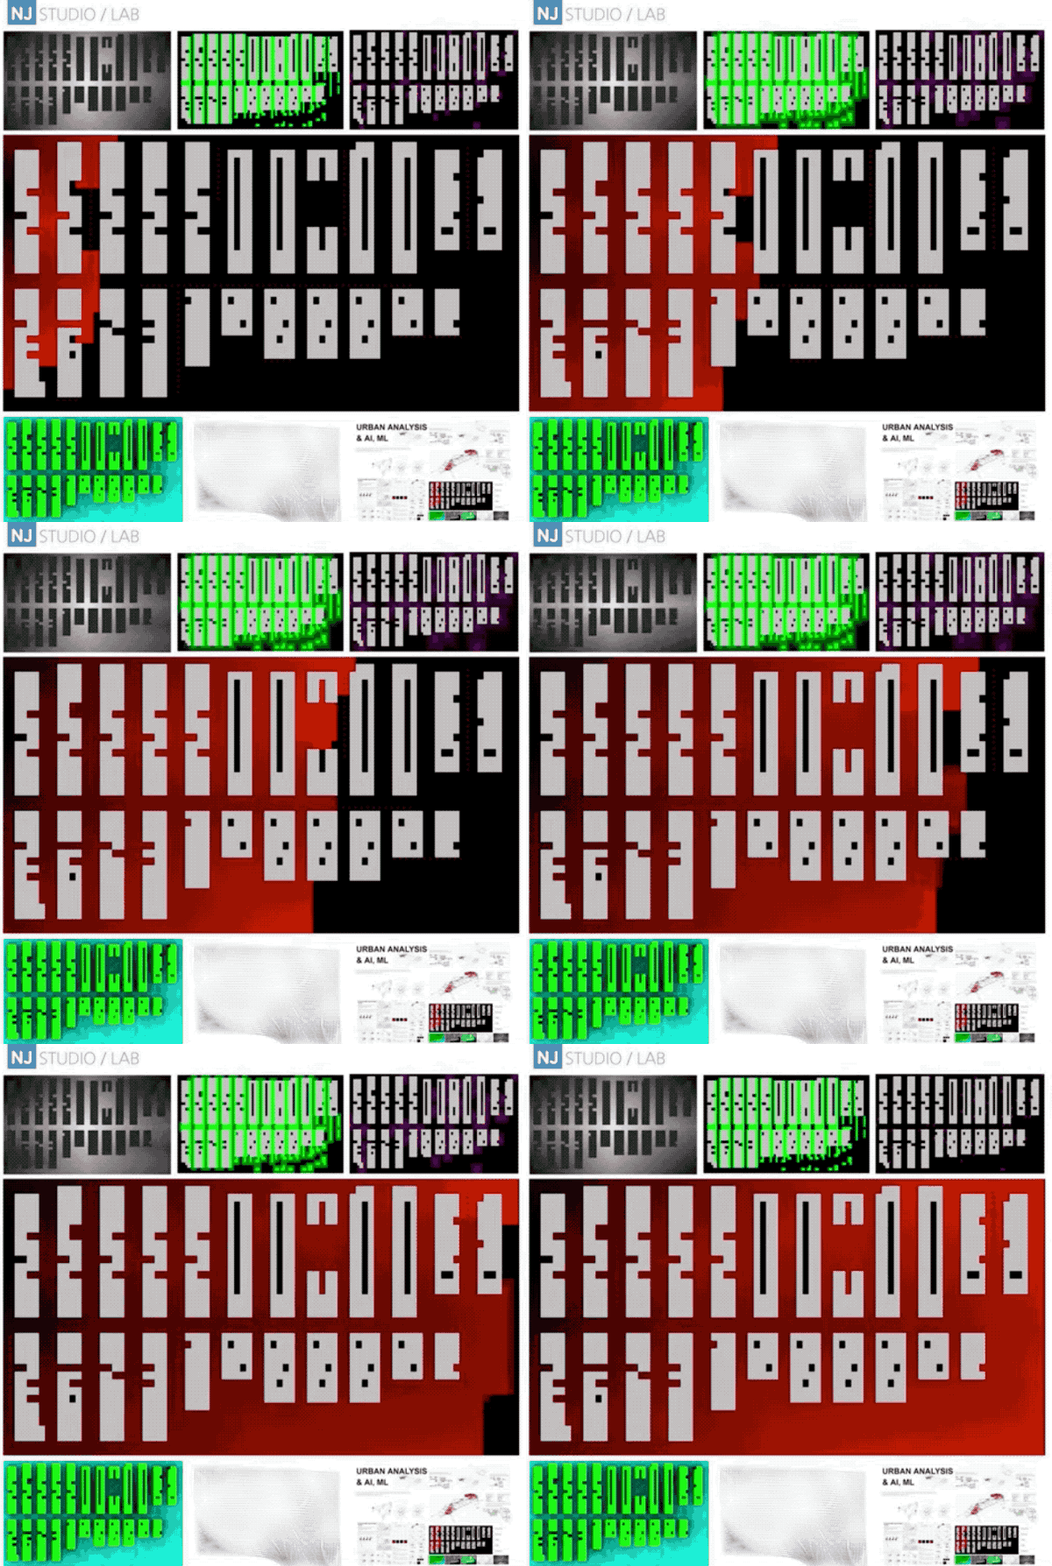

Up to this point, we have looked at the contents of designing artificial intelligence (Machine learning) training data sets for modeling phenomena. As long as the data is well-refined and prepared, the reliability of the model’s result can be secured. In other words, data preprocessing is a crucial step required by designers, and many insights can be obtained in the process of establishing the methodology. At the same time, various models exist in the implementation of artificial intelligence. Examples are regression or classification models. A learning model can be selected according to the content and type of the data. However, it is also necessary to transform it into trainable data optimized for implementing and deploying the chosen model. In other words, even when the same data is trained, it is occasionally necessary to transform it into trainable data according to the selected AI model and network. Otherwise, the desired reliability and performance of the results cannot be guaranteed.
4.5. AI model Learning, Fitting, Validating, Turning
In third place analysis prediction project, several specific hypotheses and their data sets, traditional machine learning models, and artificial neural networks were used. In this project, we focus on an artificial intelligence model that divides the third place located in the Boston area into three categories (1: food, 2: transportation, and 3: convenience) and gives a probability distribution accordingly.

The following image is the result of predicting the third place trend of 6 specific locations. Suppose you look at the consequence on the table’s leftmost side. In that case, the utility has the highest probability distribution. However, if you look at the contents, you can read that food, transportation, and utility have a very uniform probability distribution. On the other hand, if you look at the chart on the far right, you can see that the traffic has a shallow distribution, and at the same time, the distribution has a high utility.

The result above could be a character from a Boston-specific place. You can take the view that reinforces this, but by locating vulnerable spaces, you can set the direction for development with other spatial trends. For example, you can see in the map above that Forest Hills Park is the main traffic-related space. If food-related places have been continuously absent by comparison with historical data, it can be hypothesized that the characteristic of this park is a park centered on walking. From the perspective of third place, you can also change the character trends around you by increasing the density of restaurants.
The table above makes it possible to interpret the probability distribution at a given point and iteratively fine-tune the modeling through additional data and processes accordingly. Sometimes it is possible to revise the hypothesis through interpretation of the results. It is a typical process to enhance reliability by strengthening the model by adding new data sets through domain knowledge.
4.6. Model application, validation, and analysis
By learning the Third place data from Boston, LA, and Redlands through an artificial neural network (ANN), third place prediction model was trained according to cities. If you look at the learning results below, you can see that the refined data was fitted at a level of about 80–90%, and it can be seen that the number of epochs did not take much. Because, of course, the amount of data was small, but the important thing is that it was refined into data optimized for the model to be trained. The network is tuned and optimized by adjusting the depth of the network, the activation function, and the hyperparameters.

The image in the first line below visualizes the third place data. This visual information is very familiar to humans but not to computer machines. The second line image is the training data that has been preprocessed and refined. Accessibility to third place based on each region ID in a normalized space is data. Humans are vulnerable to such data pattern recognition, which becomes optimized training data for machines.


The image below results from learning and predicting the trend of third place in the Boston area (87.2 km²). And it is the result of applying and predicting the model trained with LA and Redlands area data in the same space. The density distributions of the dominated third place can be seen at a glance. Let’s scale it down.

The results and visualization below predict the third place trend of the zoomed-in Boston area (2.2 km²). It can be seen that the trend of change in the third place appears with a higher resolution, and the trend of the areas where a specific space is dominant and the places where the characteristics of the space change are more clearly revealed and show a particular pattern. So let’s scale it down further and focus on specific locations.

The image below shows the probability distribution (food, transportation, utility) value of predicting the third place for 12 locations in Boston. In addition, you can see the probability distribution that models trained on three city data predicted the same places.


There are many insights to share regarding validation and interpretation, but let’s focus on the three above. The image on the left above is Boston’s South Station. Boston and LA learning models predicted traffic with high probability. However, the Redlands model predicted amenities. Perhaps in the case of Boston and LA metropolitan areas, the trend of the third place in the downtown area and the pattern of the transportation network seem to have played a significant role. In the case of the Redlands model, it can be understood that the distribution is different from the downtown area because it is virtually impossible to walk in a typical western suburban city in the United States and has to rely on a car rather than public transportation. It explains the content of the hypothesis that “the development and distribution of the third place have inherent characteristics of the city.”.
Looking at the predicted value on the middle, in the LA model, food-related places appear highly probable. Boston and LA show relatively similar spatial distributions. However, in this case, we hypothesize which surrounding places brought different predicted results to these places and test again to explain the fundamental difference between the two cities as third place distribution/density pattern. Looking at the final result on the right, the Boston model shows a very uniform third-space probability distribution. In other words, it can be read in a space that is easily accessible from all places. In the LA model, restaurants came out high. Perhaps, as seen in the Boston model, it can be interpreted that places with easy access to all spaces show a similar pattern to places densely distributed in downtown LA. In the case of the Redlands model, as predicted, the probability of traffic is very low. This could be hypothesized to be strongly influenced by the distribution pattern of amenities scattered sporadically in the city.
After optimizing the model by training with Boston area data, a comparative analysis was performed with LA and Redlands models in the same way. The given data fit each model, and it can be a standard to interpret the results from the learned data’s perspective. Why are they similar? What spaces change along the way? Or why? Why do you expect it to be different? What more metrics do you need? How does it affect the outcome? Continue to ask questions such as repeating the preceding steps and fine-tuning the model. In the process, you may gain various perspectives and unexpected insights.
4.7. Development direction, attention, and possibility
This project deals with predictive models trained on third place data. Insights can be gained when reinforcing the third place trend captured in one city, understanding the direction of development from the past, or making the same or difference by comparing and analyzing the trend characteristics of other cities. In addition, the model is developed by projecting qualitative data such as street historicity, culture, place, event, association with surrounding areas, and pedestrian experience into the category of a countable number system, that is, as a metric. It is scalable and can lead to a highly reliable process that enables sophisticated calibration and implementation of spatial analysis models that can address metaphysical hypotheses, questions, and problems.
In the traditional programming methodologies, an error is returned when the program is wrong, and the designer is forced to correct the mistakes or errors. Since the deductive method generally takes designing a complex algorithm by making, combining, and testing small units of explicit functions, it is easy to correct errors and implement each function at a high level. In other words, you can quickly fix the result by directly modifying the logic of functions containing the error. However, in machine learning, represented by inductive programming, a specific outcome is unconditionally returned even if it has errors. That is, the results are mechanically produced by the parameters of the data and the trained model. Therefore, when understanding the consequences, correcting errors or mistakes, accurate understanding of hypotheses, selection and purification of data, and the overall process of selected artificial intelligence model, learning, fitting, and evaluation should be the subject of verification.
Otherwise, although the original error is returned and correction is required, users often believe that the wrong value is the result of artificial intelligence and use it. In particular, if AI is applied to problems for which evaluation is ambiguous even for designers, except for stages that have a clear answer and purpose in the design process, the reliability of the results can be increased by designing the strategies rationally and logically even more carefully.
Artificial intelligence will surely reach a singularity that surpasses human intelligence soon. However, suppose AI is organized based on prejudice and imagination biased by movies, mass media, popular culture, and some entrepreneurs or marketers. In that case, I believe the current AI tools and technologies are highly prone to be misunderstood. For designers, artificial intelligence is not a magic box to resolve a design issue with fancy pre-trained models or networks. But, as we saw earlier, AI is a design process of describing a design goal or problem and collecting and refining data based on what they want to achieve. Just as a designer has a concept, takes control of the site, and develops logical thinking to design a building in detail, in understanding artificial intelligence, it should be viewed as a programming method that processes hypotheses (questions, objectives) and data accordingly. Then you will be able to fully utilize the technology and methodology as creative tools for design without fear and misunderstanding.
Please check the reference below for the source code of all processes described in this project. It is often easier to understand and apply the source code than the text. When using open source code for one’s project, there may be differences in the formality of the process, but in terms of content, it can be applied in a standard pattern I describe.
5. Conclusion
From phenomena to insight, from intuition to numbers, from tacit to explicit, from experience to model…
This computational approach is not new. It is good to organize the existing traditional implicit methods into tools that describe them more precisely and explicitly, as well as methodologies and thinking systems that use them. Although this project dealt mainly with the third place data in the environment, landscaping, architecture, and urban design industries, a lot of data is needed, consumed, created, and modified from the planning stage to post-construction follow-up management. The implicit method relies on intuition and is augmented as an explicit process with the design material of data. The designer’s intuition is mutual security as a tool, not a confrontation between human and artificial intelligence, a view of development, and a shift in thinking.
Utilization of design materials (data) and tools (code, artificial intelligence)
Historically, whenever new materials are introduced, new tools handling the material are developed, presented, and become sophisticated as time goes by. The design industry has been growing based on new materials’ creative scope and environment. Expanding on the traditional material concept of design, what is the latest design material of the 21st century? It’s data. Now, we can treat the data with tools called code and algorithms (or artificial intelligence), augment existing design methodologies, and open up new possibilities that we have not experienced. We hope that more designers will have their hearts pounded by the creativity of the latest materials and tools set before us. A project on the use of data in the urban analysis process, hoping that by seizing and preparing the opportunities and required abilities that the data-driven society gives designers, the waves of the 4th industrial revolution can ride on new opportunities rather than the tsunami that strikes us.
6. Reference
Lee, N. (2021). Understanding and Analyzing the Characteristics of the Third Place in Urban Design: A Methodology for Discrete and Continuous Data in Environmental Design. In: Yuan, P.F., Yao, J., Yan, C., Wang, X., Leach, N. (eds) Proceedings of the 2020 DigitalFUTURES. CDRF 2020. Springer, Singapore. https://doi.org/10.1007/978-981-33-4400-6_11
Oldenburg, R., Brissett, (1982). D.: The third place. Qual. Sociol. 5(4), 265–284
Lee, Namju. (2022). Computational Design, Seoul, Bookk, https://brunch.co.kr/@njnamju/144
Lee, Namju, (2022). Discrete Urban Space and Connectivity, https://nj-namju.medium.com/discrete-urban-space-and-connectivity-492b3dbd0a81
Woo. Junghyun, (2022). Numeric Network Analysis for Pedestrians, https://axuplatform.medium.com/0-numeric-network-analysis-47a2538e636c
Lee, Namju, (2022). Computational Design Thinking for Designers, https://nj-namju.medium.com/computational-design-thinking-for-designers-68224bb07f5c
Lee, Namju. (2016). Third Place Mobility Energy Consumption Per Person, http://www.njstudio.co.kr/main/project/2016_MobilityEnergyConsumptionMITMediaLab
Lee. Namju, (2018). Design & Computation Lecture and Workshop Series https://computationaldesign.tistory.com/43
Presentation & Video & Plugin(Addon):
Source Code: https://github.com/NamjuLee/Third-Place-Prediction-Report-V2022
Analyzing Third Place, Paper Presentation & Panel Discussion at DigitalFUTURES 2020 — link
Demo, for Third Place Mobility, MIT Media Lab — link
Review, Third Place, Media Lab, (Korean) — link
'Workshop Index' 카테고리의 다른 글
| Code for Design, Data, and Programming (0) | 2022.12.14 |
|---|---|
| Raster (0) | 2022.12.09 |
| Computational Design Thinking for Designers (0) | 2022.12.09 |
| Data & Design (0) | 2022.12.09 |
| [특강 2022] 첨단미디어디자인전공 "1학년"을 위한 디자인, 데이터, 코딩 소개, 다가오는 시대, 기회, 준비전략, 동기부여 그리고 멘탈리티 (0) | 2022.05.13 |


